|
This report is based on an original survey of experts.
Overview
The purpose of this report is to forecast the future (2016-2021) of the North American telecommunications network, and from that forecast to identify the major equipment needs to fulfill that forecast. There has been a great deal of turmoil in the area of telecommunications, much of it leading to spectacular changes and advances. Turmoil has been created by technological changes, by regulatory changes, by the development of new products and applications, by the introductions of new, or new flavors, of services, and by the entry of non-traditional competitors.
Because of this turmoil, consumers have much greater capabilities in the broad area of telecommunications than ever before. The reality has passed the fantasy in many ways: cell phones are more capable than Dick Tracys wrist radio, and more capable than Flash Gordons communicator.
Even though there is a great deal of turmoil and uncertainty, forecasting is very important, because as a great philosopher once said;
"Without a forecast, there can be no planning.
Without planning, there can only be chaos."
This report will use the technique of asking the experts for their view of the future and then distilling from that input (some of which will be contradictory) a consistent, unified, organized view of the next five years of telecommunications in North America.
The first chapter will describe the survey that was used to "ask the experts." After that, the reader will be presented with several of the raw answers for the responders to the survey. It is intended to give the reader a first hand view of some of the material in the responders' words. Following the raw answers sample, the author will provide a summary and analysis of the answers and then the resulting forecast for the future of the network.
Finally, this general forecast will be used to provide specific equipment forecasts for this period. This will be accomplished by combining the Forecast of the Future Network that we have constructed with the Survey, with information about forecast of traffic demand and likely investment (supply). The report will thus produce detailed forecasts for the major types of equipment used in optical networks. A description of the makeup and function of each type of equipment will precede the forecast.
At the end of the report, a listing of major vendors that provide this equipment is provided a swell as Appendixes to assist in understanding traffic concepts.
Table of Contents
NETWORK OF THE FUTURE - WITH EQUIPMENT FORECASTS 1
NETWORK OF THE FUTURE - WITH EQUIPMENT FORECASTS 7
NETWORK OF THE FUTURE - WITH EQUIPMENT FORECASTS 9
THE LIGHTWAVE NETWORK SERIES OF REPORTS 9
The Lightwave Series of Reports 10
General Reports on the Network 12
Specific Systems Reports 15
NETWORK OF THE FUTURE - WITH EQUIPMENT FORECASTS 19
SURVEY SAMPLE RAW RESULTS 22
View of Future Network 2016-2021- Base Case 22
SURVEY SUMMARY AND ANALYSIS 36
FORECAST FOR NETWORK OF THE FUTURE 40
The continuing forces of disruption 40
The wired network will tend toward fiber 40
Access Network - Cellular 41
The cellular network will be forced to deploy 5G in some areas. 41
Transport facilities will become virtually all fiber 41
The Application area will see the most growth 41
TRAFFIC - THE OPTICAL NETWORK DEMAND 43
Four Major Sources of Traffic 45
Demand Growth - Summary 54
INVESTMENT - THE NETWORK SUPPLY 57
SUPPLY - CAPITAL INVESTMENT BY THE RBOCS 59
RBOC Investment Plans and Forecast 62
AT&T Investment Plans and Forecast 62
Verizon Investment Plans and Forecast 64
Summary Thoughts on Investment 69
EQUIPMENT DESCRIPTIONS AND FORECASTS 70
First Generation ROADM - PLC-Based ROADMs 72
Colorless vs. Colored Ports 73
Benefits and Problems with PLC ROADMs 74
The Second-Generation ROADM - Blocker-Based ROADMs 74
Alternative Designs for Blockers 76
Problems with Blocker-based ROADMs 77
Third-Generation ROADM - Wavelength Selective Switch (WSS) 78
Problems and Benefits of WSS ROADMs 78
Fourth-Generation ROADMS - Edge ROADM (ER) 82
Summary of ROADM Features by Utilization 82
Summary of ROADM Types by Generation 83
Summary of ROADM Description 84
ROADM Systems - US Forecast 84
Types of DWDM - 40 and 100 Gbps Channels 99
North American Forecast 100
IP and Ethernet Switches 106
North American Switch Forecast 107
What is a Terabit Router? 112
Traditional Router Technology 112
Traditional Router Applications 114
North American Forecast 116
Adva Optical Networking 122
Kingfisher International 130
Mahi Networks (formerly Photuris) - Meriton - Now Xtera 130
Marconi Corporation plc (Ericsson) 131
Movaz NEC America Inc. 135
Nortel (Now dissolved) 138
Performance Motion Devices 139
Tropic Networks (Alcatel-Lucent) 141
APPENDIX I, TRAFFIC STATISTICS RELATIONSHIPS 143
APPENDIX II, DATA TRAFFIC FUNDAMENTALS 146
Internet Traffic Calculations 146
Table of Figures
FIGURE 1, LIGHTWAVE NETWORK
FIGURE 2, TRAFFIC FORECAST - AAA LINES
FIGURE 3, MOBILE TRAFFIC FORECAST
FIGURE 4, MOBILE - WIRELINE ACCESS
FIGURE 5, INTERNATIONAL TRAFFIC
FIGURE 6, DATA TRAFFIC FROM MAJOR SOURCES
FIGURE 7, COMPARISON OF FOUR MAJOR SOURCES TO TOTAL TRAFFIC
FIGURE 8: INTERNET GROWTH RATE - NEW FORECAST
FIGURE 9, SUMMARY POINTS ON DEMAND
FIGURE 10, SUPPLY DEMAND RELATIONSHIP
FIGURE 11, NETWORK SHOWING WIRELESS ACCESS
FIGURE 12, WIRELESS DATA FORECAST
FIGURE 13, AT&T CAPITAL INVESTMENT 2009-2014
FIGURE 14, VERIZON WIRELINE CAPITAL EXPENDITURES 2009-2014
FIGURE 15, VERIZON WIRELINE NEGATIVE GROWTH
FIGURE 16, VERIZON WIRELINE REVENUE NEGATIVE GROWTH
FIGURE 17, VERIZON REVENUE PER WIRELINE
FIGURE 18: ROADM GENERAL CONFIGURATION
FIGURE 19: PLC BASED ROADM
FIGURE 20: DETAILED 'BLOCKER' ROADM ARCHITECTURE
FIGURE 21: ALTERNATIVE M-Z DIODE-BASED BROADCAST ROADM
FIGURE 22: WSS STRUCTURE
FIGURE 23: WSS-BASED ROADM
FIGURE 24: WSS-BASED MULTI-DEGREE NODE INTERCONNECTION
FIGURE 25: TYPICAL BLOCKER ROADM
FIGURE 26: WSS ADDED TO BLOCKER
FIGURE 27: SUMMARY OF ROADM TYPES BY UTILIZATION
FIGURE 28: FOUR GENERATIONS OF ROADMS
FIGURE 29, ROADM SYSTEM UNIT FORECAST - US
FIGURE 30, US MARKET - CHANGE IN PREDOMINANT TYPE OF ROADM OVER
TIME
FIGURE 31, US EDGE ROADMS SYSTEMS
FIGURE 32, PRICE FORECAST FOR ROADMS
FIGURE 33, ROADMS MARKET FORECAST - US
FIGURE 34, ROADM MARKET - US - BY TECHNOLOGY
FIGURE 35, WORLD ROADM SYSTEMS BY TYPE
FIGURE 36, WORLD ROADM MARKET
FIGURE 37, TYPICAL DWDM LAYOUT
FIGURE 38, METRO DWDM TYPICAL LAYOUT
FIGURE 39, METRO DWDM SYSTEM CHARACTERISTICS
FIGURE 40, NORTH AMERICAN DWM SYSTEM ENDS
FIGURE 41, NORTH AMERICAN DWDM MARKET
FIGURE 42, US DWDM FORECAST BY CHANNEL SPEED
FIGURE 43, DWDM - WORLD FORECAST - SYSTEM ENDS
FIGURE 44, DWDM WORLD MARKET FORECAST
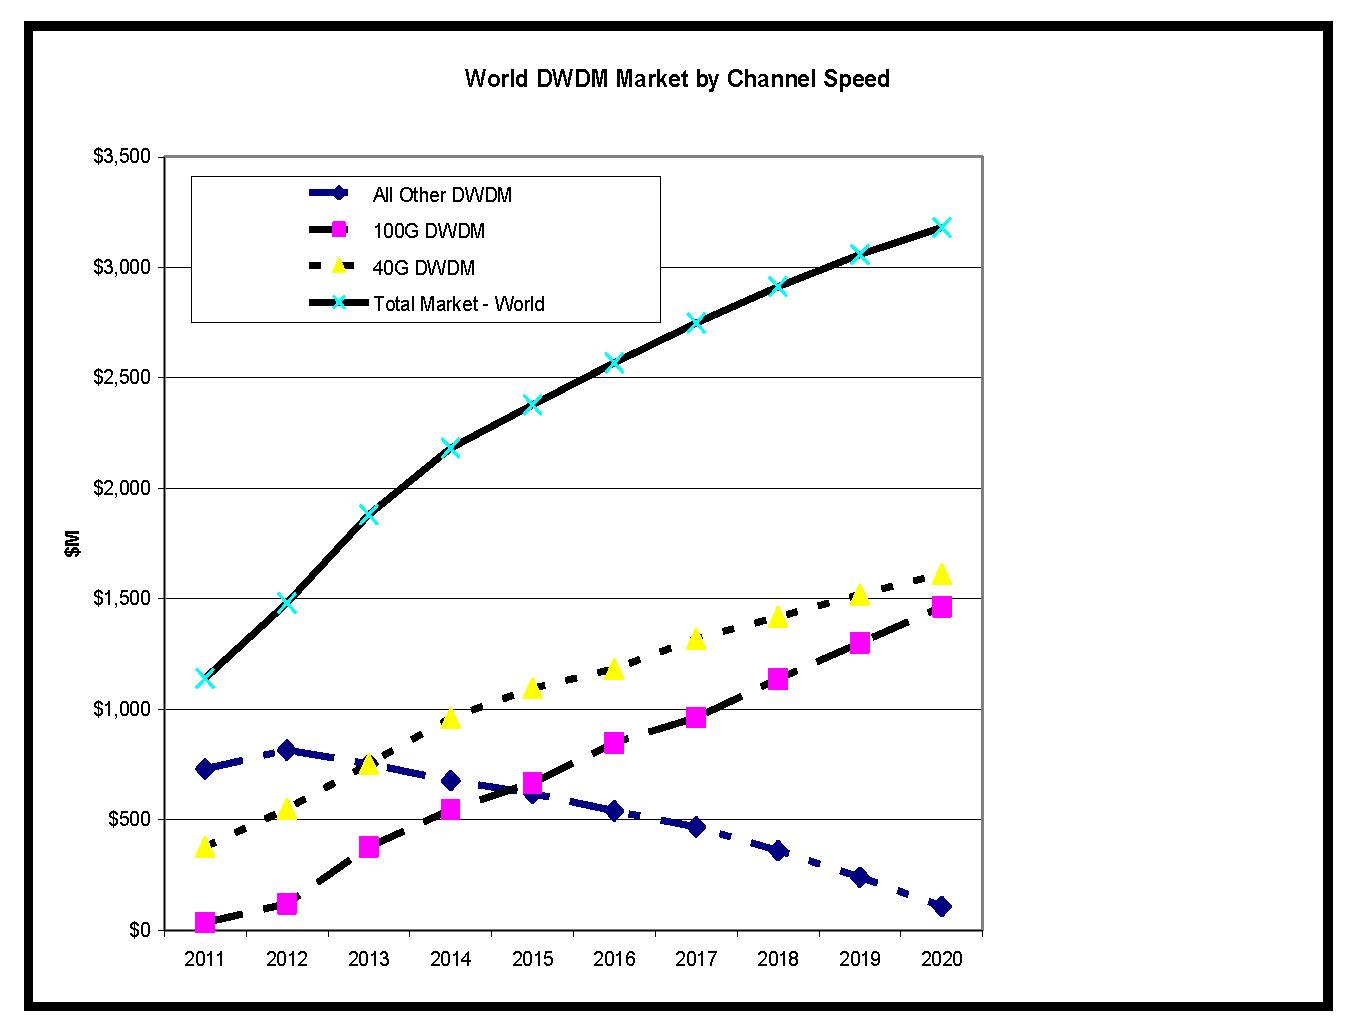
FIGURE 45, DWDM WORLD FORECAST BY SPEED
FIGURE 46, NORTH AMERICAN SWITCH MARKET FORECAST
FIGURE 47, NORTH AMERICAN SWITCHES - UNITS FORECAST
FIGURE 48, WORLD SWITCH MARKET
FIGURE 49, WORLD SWITCHES - UNITS
FIGURE 50, ROUTER LAYOUT
FIGURE 51, ROUTER APPLICATIONS
FIGURE 52, NORTH AMERICAN ROUTERS - TOTAL - UNITS
FIGURE 53, NORTH AMERICAN ROUTERS TOTAL MARKET
FIGURE 54, NORTH AMERICAN ROUTER MARKET - BY TYPES
FIGURE 55, WORLD ROUTER FORECAST - UNITS
FIGURE 56, WORLD ROUTER MARKET - TOTAL
FIGURE 57, WORLD ROUTER MARKET - BY TYPES
FIGURE 58: TRAFFIC/SPEED RELATIONSHIPS
FIGURE 59: EXAMPLE OF VARIOUS TRAFFIC SIZES
FIGURE 60, MULTIPLES OF BYTE
FIGURE 61: NEW TRANSFER RATE FORECAST
FIGURE 62: SUMMARY OF CONCEPTS
Back to Top
|